What values can the Pearson correlation coefficient take?
The Pearson correlation coefficient,
r, can take a range of
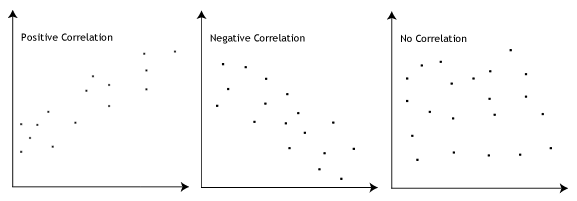
values from +1 to -1. A value of 0 indicates that there is no
association between the two variables. A value greater than 0 indicates a
positive association; that is, as the value of one variable increases,
so does the value of the other variable. A value less than 0 indicates a
negative association; that is, as the value of one variable increases,
the value of the other variable decreases. This is shown in the diagram
below:
How can we determine the strength of association based on the Pearson correlation coefficient?
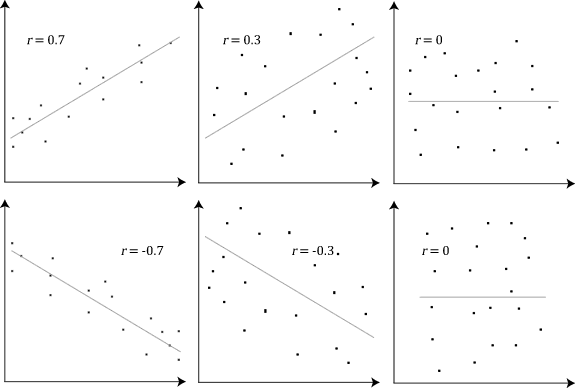
The stronger the association of the two variables, the closer the Pearson correlation coefficient,
r,
will be to either +1 or -1 depending on whether the relationship is
positive or negative, respectively. Achieving a value of +1 or -1 means
that all your data points are included on the line of best fit – there
are no data points that show any variation away from this line. Values
for
r between +1 and -1 (for example,
r = 0.8 or -0.4) indicate that there is variation around the line of best fit. The closer the value of
r
to 0 the greater the variation around the line of best fit. Different
relationships and their correlation coefficients are shown in the
diagram below:
No comments:
Post a Comment